The User Interface
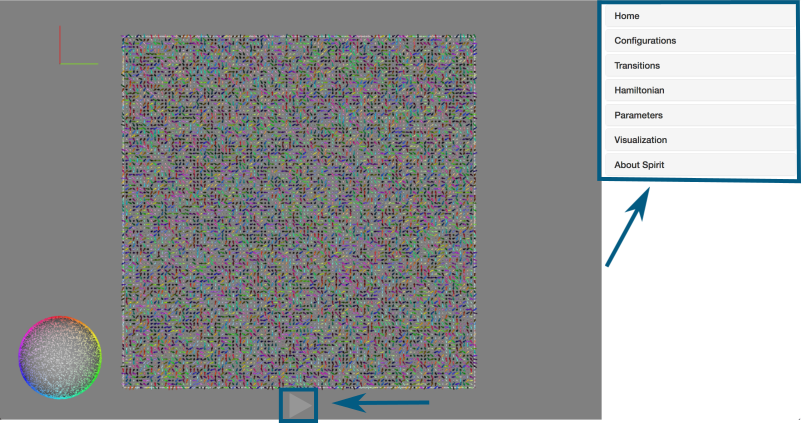
There are two important ways of interacting with the spin system you see when entering the WebApp: the Play/Pause button at the bottom and the panes. The following sections will explain some of the most interesting features you have at your disposal.
Visualisation Features
Surface Visualisation
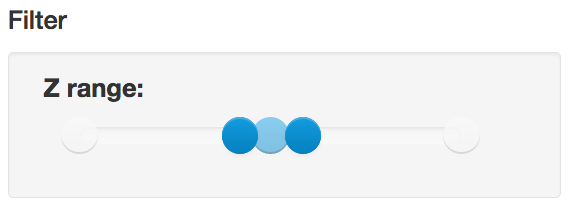
You should play around with the surface visualisation mode and especially the z-range filter. You will find them in the Visualization pane.
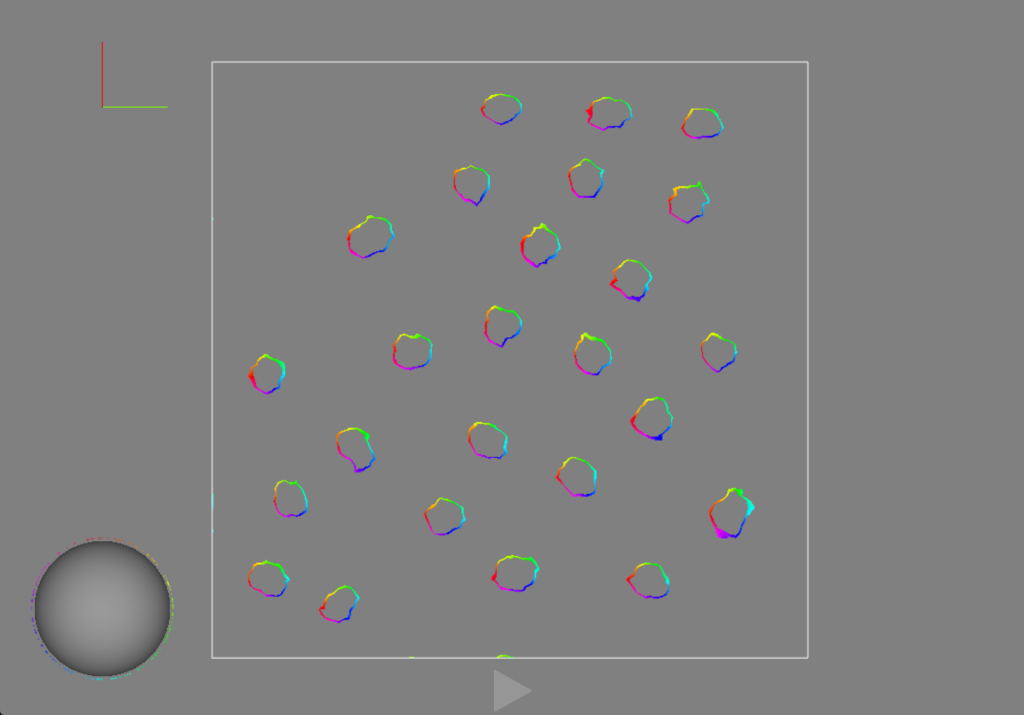
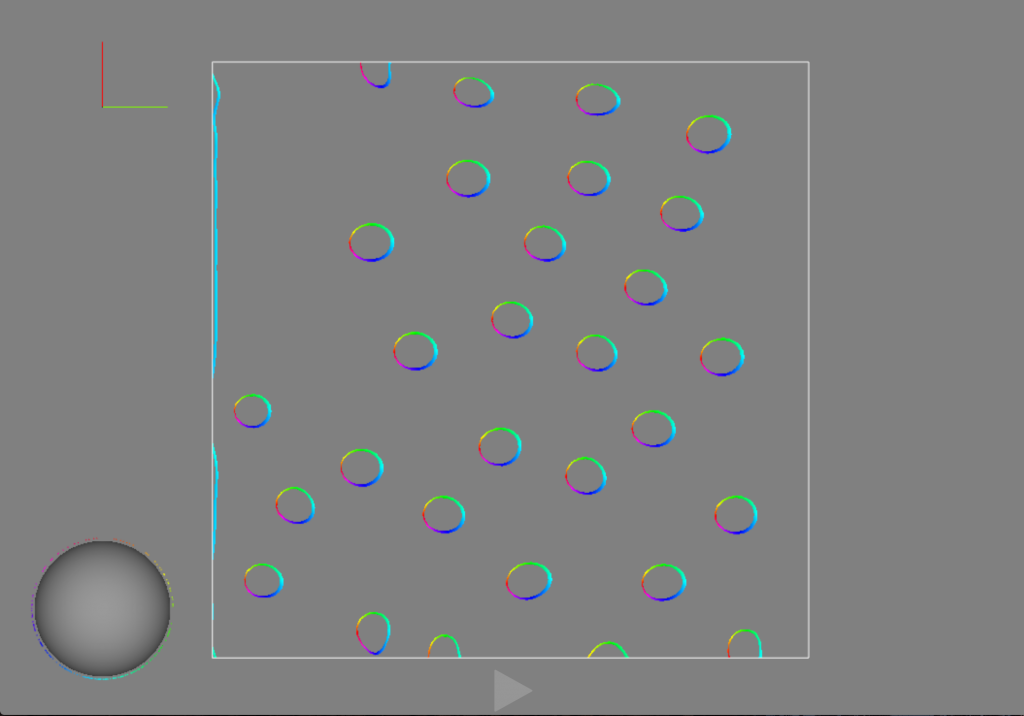
The following image shows the visual effect of the z-range filter on the surface visualisation. Due to the interpolation, smooth circles are visible representing the contours of the skyrmions in the system. Two effects are visualised: temperature distorting the contours randomly and a spin polarized current blowing new skyrmion bubbles at the bottom edge.
Spin Sphere
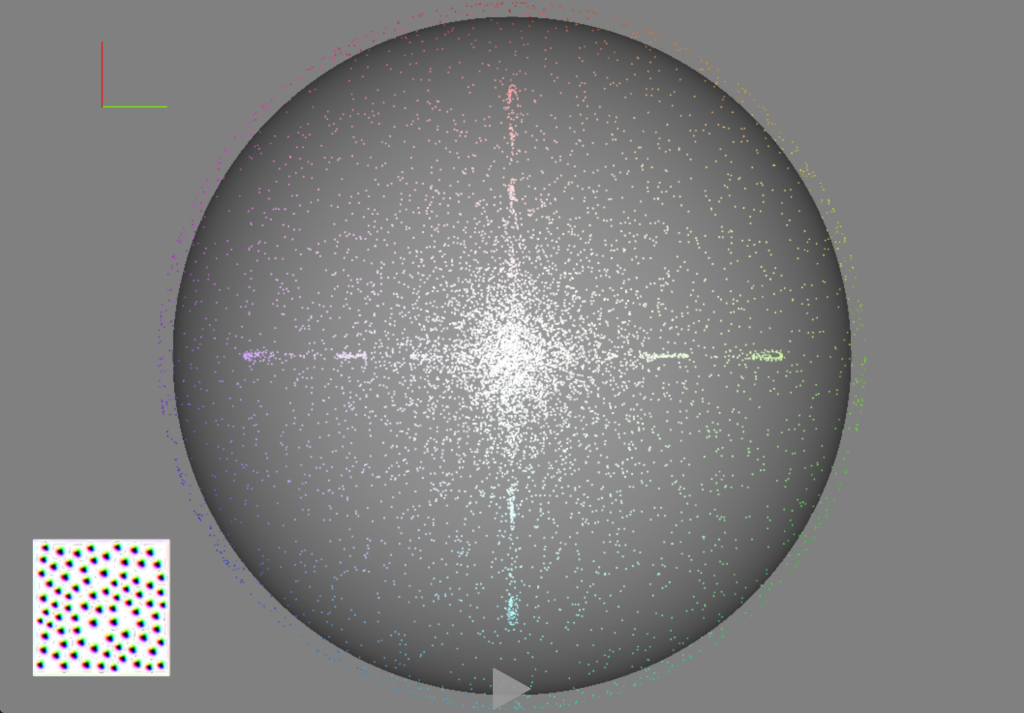
A “Spin Sphere” visualisation is available in order to make symmetries or system-wide structures visible to the user. Each dot on the sphere represents the direction of one of the spins in the system. This quite nicely visualises the applied colormap.
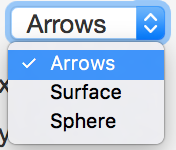
To visualise the sphere in large, select it in the Rendermode dropdown in the Visualization pane:
Configurations
You may easily change the current spin configuration, e.g. to one of the following, by using the Configurations pane.
- Random
- Homogeneous
- Skyrmion
- Spin Spiral
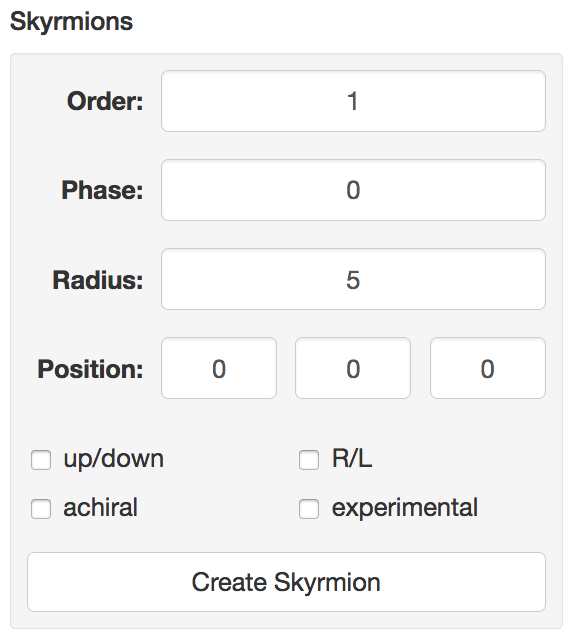
As an example consider a skyrmion: you can insert a skyrmion of any radius at any position in the system. The phase controls the chirality and the order controls the winding number.
Hamiltonian
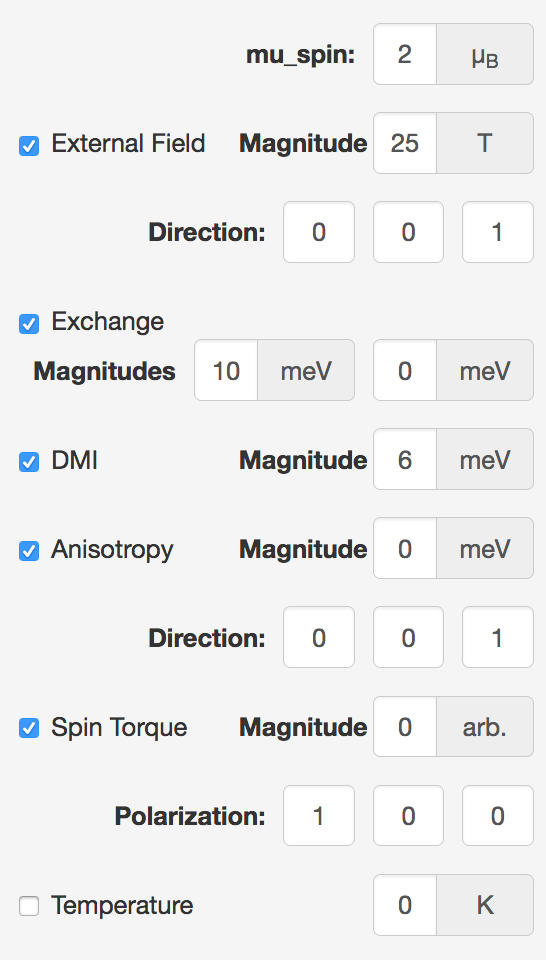
You may vary external magnetic field and anisotropy, exchange and DMI interaction parameters, as well as spin polarised current and temperature. You can play around with and vary these parameters while running simulations to get a feeling for the influence they have. For example, reducing the magnetic field may increase the size of skyrmions and vice versa.